Visualisations
A dynamic visualisation for the data contained in this site is available via the eScholarship Research Centre's ConneX: Contextual Network Explorer.
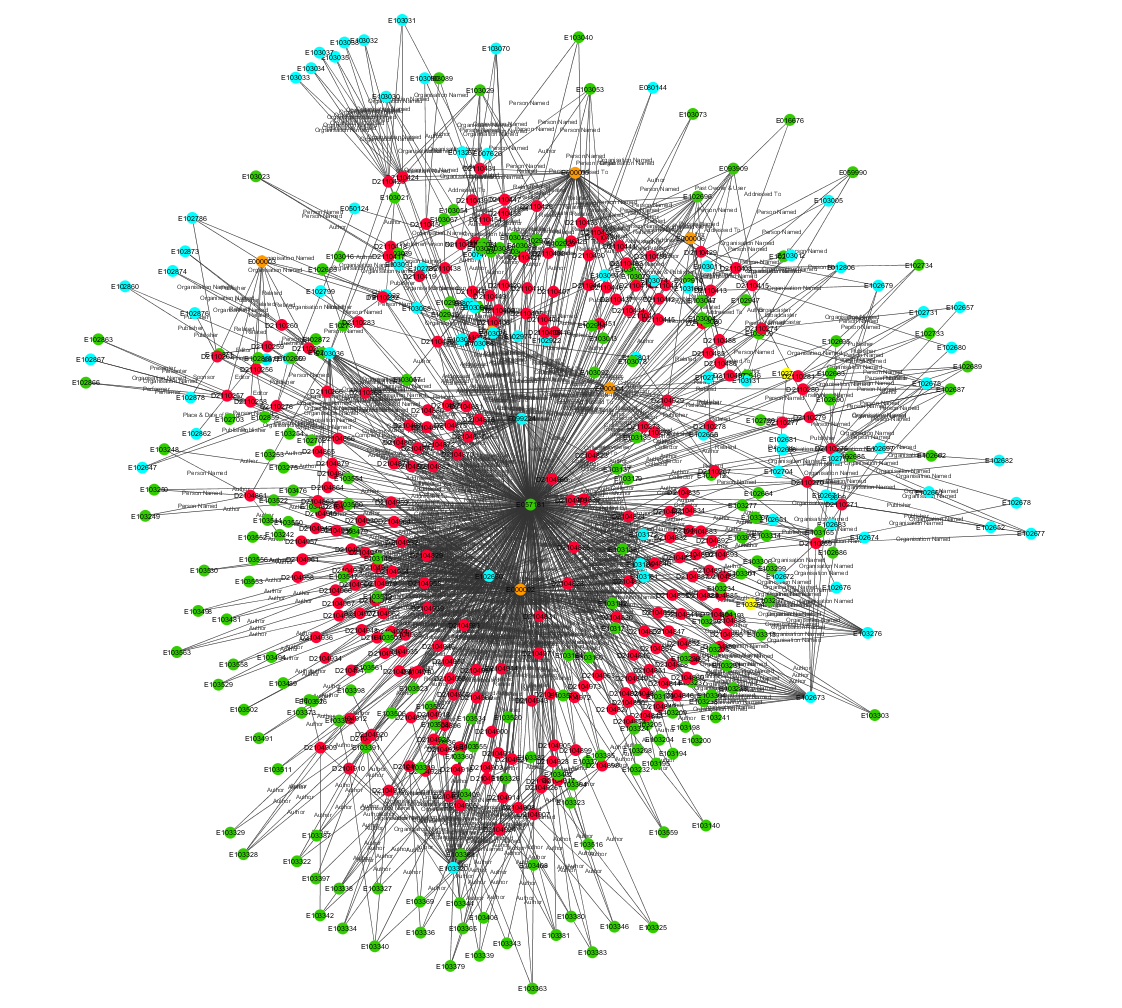
The visualisation below was created using Cytoscape, and represents all the nodes (entities and digital objects) and edges (relationships) contained in the Online Heritage Resource Manager as of 27 November 2015.